Inside PBL: Zero Sum Project
When you enter The Zero Sum Game, you have to be ready—ready to negotiate, ready to form alliances, ready to persuade other countries to do business with you. You are Russia, India, Saudi Arabia, Mexico, Algeria, Sudan, Nigeria, Kenya, and Venezuela—Third World countries struggling to become players in the world economy.
Resources are limited, so knowledge, strategic thinking, communication, analysis, and persuasion will determine the outcome. If you win, everyone else loses because in a zero sum game, gains made by one player result in fewer resources for the others.
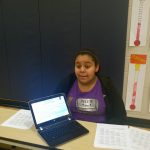
 It’s a Thursday evening. In the cafeteria, tables bear signs announcing the names of participating nations. Students gather at each table, each group studying data outlining important historical, political, and economic facts and the conditions for winning which include having the most cash, the most oil, and the most alliances with other nations. The World Bank at the front of the room is open for business. The game begins.
During the next 2 hours—12 rounds of play—students will demonstrate historical understanding as well as an understanding of modern-day political and economic relationships between nations, the power of supply and demand, their abilities to use algebraic and geometric skills to create linear equations in real time to calculate the effects of various monetary interactions, and their speaking and listening skills—especially the ability to quickly reason and negotiate.
The game is structured to pose various kinds of economic dilemmas. Some are obvious: If a nation needs natural resources, who will they buy from and how much will they pay? If they pay too much, what will happen to their ability to build infrastructure? Some are more subtle: If a nation invests heavily in health care and thereby life expectancy increases, what will this cost in social services and how will this affect their economy?
To sharpen the competitive edge of the game, community members and parents who are attending this exhibition of student work are invited to join as delegations of First World nations such as the US and Japan. Also, during each round, two countries experience “random events” that affect their status. For instance, in Round 5, Russia becomes an independent federation which raises their GDP by 20%; in Round 11, Kenya faces regional flooding, lowering their GDP by 10%.
Two teachers with a commitment to project-based learning (PBL) designed this project to give their students a chance to be in charge of their own learning in an exciting and relevant way. They also designed it within the construct of their district’s power standards and learning targets. In the course of the project over 14 weeks, students could demonstrate mastery of 18 social studies learning targets and 21 algebra or geometry learning targets (students from both math classes were involved). They also were assessed on language arts standards in writing and presentation skills.
The short explanation from their project planning document sums up the scope of the inquiry students were involved in:
Throughout this project we will investigate how modern nations balance the competition for natural resources, the maximization of gross domestic product (GDP), and social services like education, health care, and infrastructure. You will assume the role of national government for your home nation, and in teams, you will have to balance your nation’s needs for energy, income, and social welfare—all while you compete against other nations for resources in a zero sum game.
Participating in the exhibition night simulation game was only one of the deliverables required. Students did a series of math assignments that prepared them to set up the appropriate equations during the game to predict the outcomes of the variables in play. They created visuals—a national map with geographic and demographic data, world/regional map with economic and environmental data, and an organizational chart for the home nation’s government, all including labels and written explanations. They did graphs demonstrating changes in GDP that displayed the effects of the investments their nations made in health and welfare, education, and STEM infra-structure. They made individual presentations prior to exhibition night, took an essay test, and wrote self-evaluations.
What drives the best integrated STEM projects? It takes a team of teachers who have deep content knowledge plus curiosity about how the skills of their discipline work to help solve the bigger problems that face us all. They work together to weave an intricate web of activities arising from the standards they are required to teach that will make students work to find answers to the fascinating questions their teachers put before them.
By Pamela Wise